Authors
Delphine Garin and Larissa van der Feen
Learning from the case study Evaluating progress on plastic pollution mitigation: circularity & plastic footprint.
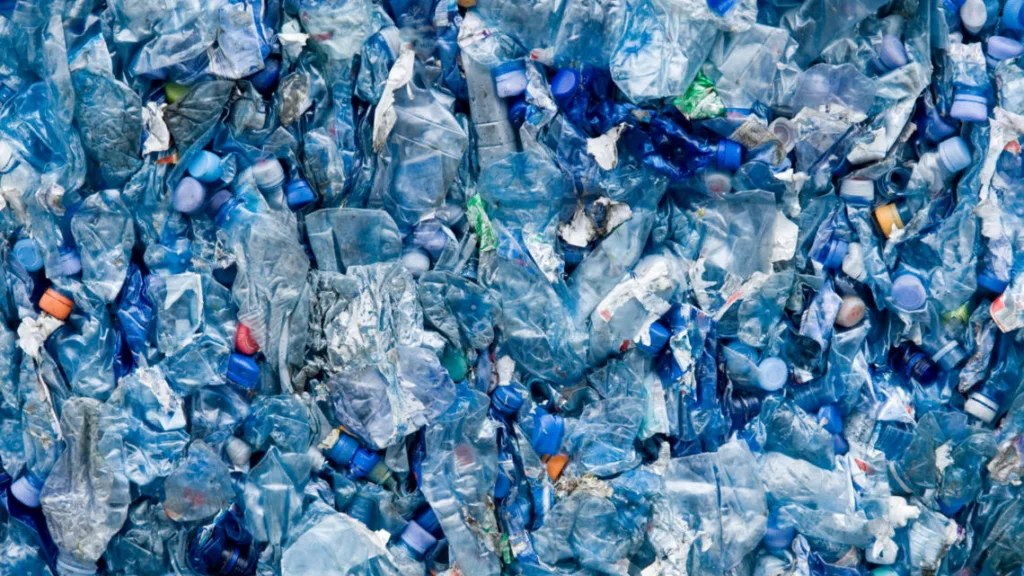
We face a global resource crisis where demand is outstripping supply, but at the same time, every day, the equivalent of over 2,000 garbage trucks full of plastic are dumped into our oceans, rivers and lakes. The system is broken. Today, only 9% of plastic is recycled worldwide. The resource-inefficient, take-make-waste plastic economy is at the core of the plastic pollution crisis.
Businesses have a key role to play to end plastic pollution, although they cannot do it alone. Policies and finances are needed for companies to realize their circularity potential. This is what the UN Treaty on Plastic Pollution is designed to provide. At the same time that UN Member States delegates continue the negotiations on this UN Treaty in 2024, EA Earth Action developed the case study Evaluating progress on plastic pollution mitigation: circularity and plastic footprint, supported by WBCSD, and looked at business circularity strategies and performance measurement.
What circularity strategies used in the case study have the most impact on reducing plastic pollution?
The case study compares the impact on plastic pollution of several circularity actions between 2023 and 2040 that are implemented by a large sports equipment producer1 (with textiles, sports equipment, shoes and packaging as products using plastic). The waste management hierarchy informs the circularity strategies in the different scenarios of the case study – an order of preference for the sustainable management of waste – starting with waste prevention and elimination as the preferred option, then reuse, recycling, recovery and finally disposal (sending waste to landfill) as the last resort.
To measure the impact of the circularity actions implemented by the company, two metrics are used in the case study: material circularity (measuring the performance of the company in closing material loops; and plastic pollution (measuring the tons of plastic waste that are mismanaged, including leakage to ocean and waterways).
In Scenario B (Scenario A is business as usual), the company increases recycled content and improves eco-design, enhancing its circularity score but not reducing plastic pollution due to the lack of downstream waste management. In Scenario C, the company adds repair services and take-back schemes, boosting material recovery and further improving circularity, but plastic pollution still rises, though at a slower rate, due to company growth. In Scenario D, the company adopts reduction strategies, such as reducing plastic content and eliminating single-use plastics, along with existing recovery efforts, leading to the most significant reduction in plastic pollution, even though the circularity score remains the same as Scenario C (the Circular Transition Indicators used in the case study do not currently factor in reduction actions in its methodology).
What are the key actions and associated indicators companies should use to measure performance?
The case study shows that actions following the waste hierarchy are needed (including reduction) to reduce plastic pollution, while performance measurement needs to go beyond closing the materials loops to integrate actions focused on reduction. Therefore, actions and associated indicators are about2
- Closing the loop with the indicator that measures materials circularity. The indicator used in the case study comes from the WBCSD Circular Transition Indicators, measuring the company’s effectiveness in closing the loops between the materials streams entering the company (i.e. linear/circular inflows) and those leaving the company (i.e linear/circular outflows). This indicator should be complemented by:
- Narrowing the loop with an indicator that reflects the absolute reduction of the total amount of materials a company puts on the market, including the elimination of problematic and unnecessary plastic products. It should be noted that if companies plan to move to plastic alternatives, they should always adopt a scientific LCA-based approach to avoid unintended consequences.
- Slowing the loop with an indicator that shows the increased product longevity and the transition to reuse/refill models. Although embedded in CTI (circularity of outflow and lifetime extension) it deserves a separate measurement to reflect efforts from companies to move away from single-use and short-lived plastics.
Companies can only effectively manage their performance on circularity and end plastic pollution thanks to implementing these complementary actions and using indicators that reflect the full set of actions associated with the waste management hierarchy.
And since the ultimate goal is to end plastic pollution, companies should use the plastic pollution impact metric (highlighting mismanaged plastic waste) as developed by the Plastic Footprint Network to evaluate the effectiveness of their circularity strategies.
What is corporate accountability in the context of the UN Treaty?
The UN Treaty on plastic pollution will include a multi-stakeholder action agenda (as mandated by UN resolution 5/14) as a mechanism to engage non-state actors in the implementation of the treaty. While the UN Treaty should clearly define the mandate of the multistakeholder action agenda with strong engagement rules, the action agenda provides an opportunity to embed clear accountability rules so that progress can be reported year after year – including progress from business in their transition to circular and sustainable products.
In addition, the call from CDP to include mandatory corporate disclosure in the global plastics treaty is a key accountability enabler to allow for global harmonization of plastic-related data. This would ensure that consistent, comparable, and high-quality data can be shared with stakeholders – including financial institutions – to make informed decisions.
The UN Treaty on Plastic Pollution needs to provide a robust enabling policy environment so that companies can accelerate their actions towards a circular economy. Without waiting for the UN Treaty to be implemented, companies can start taking actions as shown in the case study. This case study complements the draft plastics protocol we published ahead of INC-3 last November. The plastics protocol seeks to generate alignment among organizations to create common ground for plastic-related target setting, accounting, and roadmap development.
- Real-life modeling of a company’s plastic pollution mitigation actions that Earth Action collaborated on in 2023. Sales volumes and company growth have been altered to protect the company’s anonymity. ↩︎
- Reference for the Narrow, Slow, Close the flows: Bocken, N. M., De Pauw, I., Bakker, C., & Van Der Grinten, B. (2016). Product design and business model strategies for a circular economy. Journal of industrial and production engineering, 33(5), 308-320. ↩︎
Outline


