A Global Framework for Regenerative Agriculture
WBCSD's initiative to drive business alignment
holistic outcomes aligned
businesses engaged directly and indirectly
businesses aligned on outcomes
partners operating in the ecosystem united
It is time to converge all efforts on how we measure, report and disclose on regenerative agriculture outcomes to allow for deeper regeneration and achieve the impact needed to scale this transition.
Our mission
We unite to collectively consolidate key frameworks to accelerate cross-sectoral business alignment on how to measure and report on regenerative agriculture outcomes.
This initiative is part of the World Business Council for Sustainable Development and One Planet Business for Biodiversity’s collaborative efforts to align the private sector on a shared vision for regenerative agriculture.
The challenge
The urgent need for a transformative approach to agriculture has never been more critical. Farmers work the way they do because of the current public and private incentives in place. To safeguard supply chain resilience and transition to agricultural models that operate within planetary boundaries, we need coordinated demand signals from agricultural value chain players.
The opportunity
The solution
Regenerative agriculture outcomes
Leading private sector actors and partners are increasingly taking action and calling for a holistic approach to regenerative agriculture that encompasses environmental, social and economic outcomes.
Our collective vision for regenerative agriculture includes 11 cross-sectoral outcomes, aligned with key sustainability frameworks, planetary boundaries and UN SDGs.
This approach accelerates regenerative agriculture among stakeholders, strengthens corporate accountability, enhances supply chain resilience and enables financing that supports farming communities.
Our collective vision for regenerative agriculture
Core metrics
| Indicator | Metric |
| Greenhouse gas emissions | MT CO2 e/yield or metric ton of product |
| MT CO2 e total |
Alignment info
- Framework alignment: GHG Protocol, SBTI Flag, TCFD, CSRD, CDP, GRI, IFRS
- Planetary boundaries: climate change
- Other outcome connectivity: biodiversity outcomes, soil outcomes
More information
Core metrics
| Indicator | Metric |
| Total carbon sequestration | MT CO2 e total |
| Soil carbon sequestration | MT CO2 e total |
Alignment info
- Framework alignment: GHG Protocol, SBTI Flag, TCFD, CSRD, CDP, GRI, IFRS
- Planetary boundaries: climate change, biogeochemical cycles, novel entities
- Other outcome connectivity: biodiversity outcomes, water outcomes, soil outcomes
More information
Core metrics
| Indicator | Metric |
| Natural/ restored habitat in agricultural landscapes | Natural/semi-natural habitat (NSH) in agricultural land (% per km2) |
Additional metrics
| Indicator | Metric |
| Natural/ restored habitat in agricultural landscapes | Configuration of habitat: → Connectance index → Proportion of NSH core area → Field border density |
| Presence/abundance of priority species | Farms where priority species are stable or increasing in abundance (% of farms) |
Alignment info
- Framework alignment: SBTN Land, TNFD, CSRD, GRI, ISSB
- Planetary boundaries: climate change, biogeochemical cycles, land system change, biosphere integrity, freshwater use
- Other outcome connectivity: climate outcomes, water outcomes, soil outcomes
More information
Core metrics
| Indicator | Metric |
| Crop diversity | Crop diversity per km2 (modification of the Hill-Shannon Diversity Index) |
Additional Metrics
| Indicator | Metric |
| Crop diversity | Soil water holding capacity (%) ([volume of water/total volume of saturated soil] x 100) |
More information
Core metrics
| Indicator | Metric |
| Pesticide risk | Environmental Impact Quotient field-use rating (EIQ score ecological component x application rate) |
Alignment info
- Framework alignment: TNFD, CSRD, GRI, ISSB
- Planetary boundaries: climate change, novel entities
- Other outcome connectivity: climate outcomes, water outcomes, soil outcomes
More information
Core metrics
| Indicator | Metric |
| Nutrient loss | Nutrient use efficiency (%) |
Additional metrics
| Indicator | Metric |
| Nutrient loss | Nutrient loss at edge of field (kg/ ha) |
| Loading of nitrogen (N) and phosphorus (P) to receiving water bodies (kg/month/ha) | |
| Total suspended solids | TSS of receiving water bodies (mg/L) |
Alignment info
- Framework alignment: CDP, CSRD, GRI, ISSB, SBTN Freshwater, TNFD
- Planetary boundaries: biogeochemical cycles, biosphere integrity, freshwater use
- Other outcome connectivity: biodiversity outcomes, climate outcomes
More information
Core metrics
| Indicator | Metric |
| Blue water | Blue water withdrawal (m3/ha) split by level of water stress risk |
Additional metrics
| Indicator | Metric |
| Blue water | Blue water withdrawal (m3/ha) aligned with environmental flows |
| Water consumption or Evapotranspiration (m3/ha) | |
| Green water | Soil water holding capacity (%) ([volume of water/total volume of saturated soil] x 100) |
Alignment info
- Framework alignment: CDP, CSRD, GRI, SBTN Freshwater, TNFD
- Planetary boundaries: biosphere integrity, freshwater use
- Other outcome connectivity: Biodiversity outcomes, soil outcomes
More information
Additional metrics
| Indicator | Metric |
| Soil organic carbon | MT CO2e total [Core climate metric] |
| SOC/Area or tons of carbon/ha | |
| Green water | Soil water holding capacity (%) [Additional water metric] |
| Infiltration rate | mm/hr |
| Bulk density | Dry weight of soil in a given volume, g/cm3 |
| Availability of soil nutrients to plants | Amount (mg/kg) of plant available macro/ micronutrient in soil sample (N, P, K, SOM) |
| Soil invertebrate diversity | Species richness and abundance of macroinvertebrates (incl. earthworms where relevant) |
| Soil microbial diversity | Microbial biomass |
| DNA-based metrics | |
| Soil erosion | Tons/ha |
| % bare ground cover |
Alignment info
- Planetary boundaries: climate change, biogeochemical cycles, land system change, biosphere integrity, freshwater use
- Other outcome connectivity: climate outcomes, biodiversity outcomes, water outcomes, economic outcomes, social outcomes
More information
Core metrics
| Indicator | Metric |
| Farm net income | Farm net income (LCU) / ha / year |
Additional metrics
| Indicator | Metric |
| Farm net income | % of farm households that meet or are above the living income benchmark |
| ROI (profit / ha) – including yield, input prices and crop prices | |
| Farm worker remuneration | % of farm workers whose remuneration (LCU) meets or is above the living wage benchmark |
| Farm economic resilience | Inter-year variability of farm net income (LUC) / ha (5-year rolling average) |
Alignment info
- Framework alignment: GRI, CSRD, CSDDD
- SDG connectivity: 1. No Poverty, 2. Zero Hunger, 8. Decent Work & Economic Growth
More information
Additional metrics
| Indicator | Metric |
| Food security | % of farm households classified as food secure (i.e., that do not fall within the moderate or severe food insecurity categories) in the past 12 months |
| Mental health | % of farmers reporting moderate to high well-being (i.e. > threshold |
More information
Alignment information
SDG connectivity: 2. Zero Hunger
More information
(Note: particular sectors may include additional outcomes, such as animal welfare as a key category for the fashion, apparel and textile sector as outlined in the Textile Exchange Regenerative Outcome Framework)
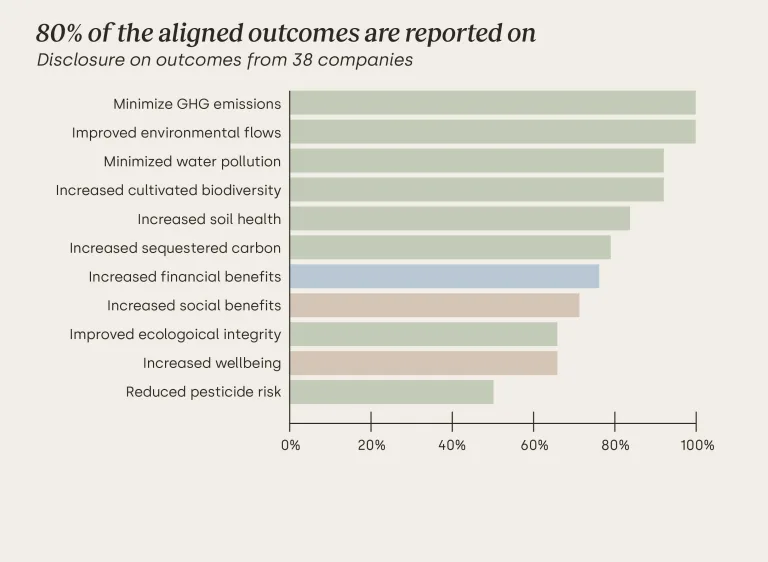
of aligned outcomes are reported on
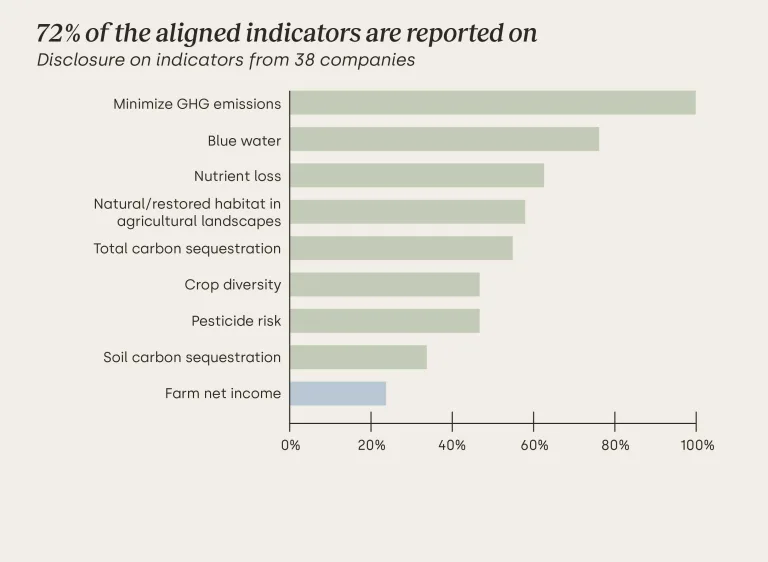
of aligned indicators are reported on
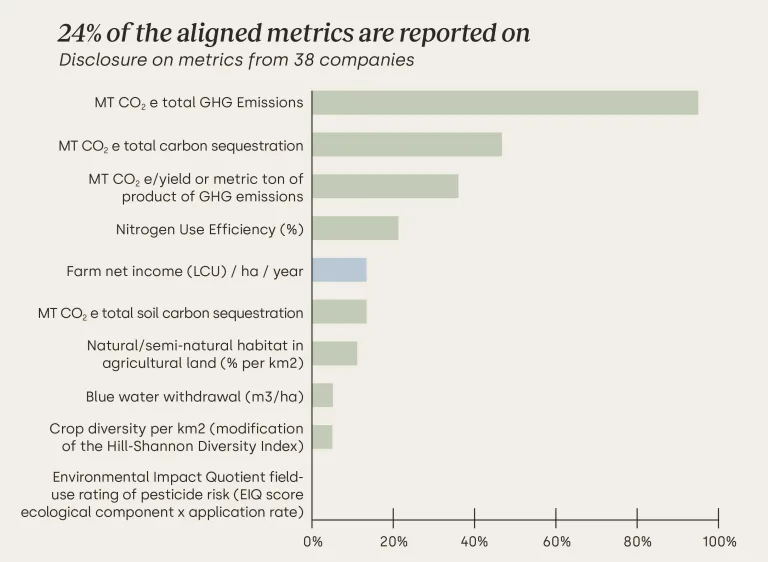
of the aligned metrics are reported on
A review of 38 leading agri-food companies publicly disclosed information reveals growing momentum:
businesses are moving beyond alignment to implementation and are reporting progress against best-practice outcomes, indicators and metrics. Learn more here.
Knowledge hub
To support businesses in the transition to regenerative agriculture, we have developed a series of guidance and materials together with members and partners, including Regen10.
We are always seeking to incorporate new and updated resources and welcome inputs to keep this page updated.
Find business-led examples in the Regenerative Agriculture Impact Stories
Glossary
| Above- and below-ground carbon sequestration | Increasing the uptake of CO2 and storage of carbon in biological sinks.24 Includes carbon stored in the carbon pools of specific habitats, such as trees, above-ground biomass, roots and soil. |
| Above-ground biomass carbon pool | Carbon in terrestrial living woody or herbaceous vegetation 2mm in size or greater. Example: carbon in trees, shrubs, plants. |
| Agroforestry | Growing trees and shrubs with crops and/or animals in interacting combinations on the same unit of land. |
| Below-ground biomass carbon pool | Carbon in terrestrial live roots 2 mm in size or greater. Example: carbon in roots. |
| Biodiversity | According to IPBES, “The variability among living organisms from all sources including terrestrial, marine and other aquatic ecosystems and the ecological complexes of which they are a part. This includes variation in genetic, phenotypic, phylogenetic, and functional attributes, as well as changes in abundance and distribution over time and space within and among species, biological communities and ecosystems. |
| Bulk density | The density of a volume of soil as it exists naturally, it includes air space, organic matter, and soil solids. |
| Blue water | Rivers, lakes, reservoirs and renewable groundwater stores. |
| CO2 equivalent (CO2-e) | The universal unit of measurement to indicate the global warming potential (GWP) of each of the six greenhouse gases, expressed in terms of the GWP of one unit of carbon dioxide. It is used to evaluate releasing (or avoiding releasing) different greenhouse gases against a common basis. |
| Ecosystem services | According to IPBES, “A service that is provided by an ecosystem as an intrinsic property of its functionality (e.g. pollination, nutrient cycling, nitrogen fixation, fruit and seed dispersal). The benefits (and occasionally disbenefits) that people obtain from ecosystems. These include provisioning services such as food and water; regulating services such as flood and disease control; and cultural services such as recreation and sense of place. In the original definition of the Millennium Ecosystem Assessment the concept of ecosystem goods and services is synonymous with ecosystem services |
| Emissions scopes | The GHG Protocol classifies a company’s GHG emissions into three scopes. Scope 1 emissions are direct emissions from owned or controlled sources. Scope 2 emissions are indirect emissions from the generation of purchased energy. Scope 3 emissions are all indirect emissions (not included in scope 2) that occur in the value chain of the reporting company, including both upstream and downstream emissions. |
| Environmental flows | The quantity, timing and quality of water needed for functioning ecosystems. |
| Green water | Terrestrial precipitation, evaporation and soil moisture. |
| Indicators | Values or characteristics that provide insight into a particular phenomenon or situation. |
| Natural habitat | According to IPBES, “Areas composed of viable assemblages of plant and/or animal species of largely native origin and/or where human activity had not essentially modified an area’s primary ecological functions and species composition. |
| Natural or semi-natural habitat | A habitat within or outside a crop made up of a community of primarily native, non-crop plant species, which human activity may modify but is able to contribute to enhanced ecosystem services. |
| Metrics | System or unit of measurements |
| Planetary boundaries | Those considered indicators of healthy agroecological systems that can help to maintain the functioning of key ecosystem services. This can include taxa of importance for ecosystem services provision, functionally important groups or indicator species of ecosystem integrity. |
| Riparian buffer | Riparian refers to an area along a stream or riverbank. A riparian buffer is essential to preserving water quality on farmland. |
| Soil carbon pool | → Mineral soil organic carbon (SOC): Carbon in soil organic matter that is smaller than 2 mm in size in soil types not classified as organic soils. Example: carbon in topsoil of croplands from particulate organic matter or microbial biomass.
→ Organic SOC: Carbon in soil organic matter that is smaller than 2 mm in size in organic soils that have organic horizon >10 cm or which have greater than 12-20% organic carbon by weight. Example: carbon in peat soils or wetland organic soils. |
| Soil inorganic carbon | Carbon in soil carbonates and other mineral carbon forms. Example: carbon in calcium carbonates in desert soils. |
| Soil organic carbon (SOC) | Soil organic carbon is the carbon component of soil organic matter. |
| Soil organic matter (SOM) | Any material produced originally by living organisms that is within or returned to the soil. It is composed of soil microorganisms such as bacteria and fungi as well as decaying material from once-living organisms and fecal material. |
| State-pressure-response framework | State of nature
Pressure
Response |
| Total suspended solids (TSS) | The overall mass of particles suspended in a water sample. The TSS are usually captured by a filter during sampling. This is distinct from total dissolved solids, which measures the dissolved fraction. |
| Outcomes | Quantitative or qualitative parameters that measure achievement or reflect changes over time; may be short or long term. |
| Water consumption | Sum of all water withdrawn and incorporated into products, used in the production of crops or generated as waste, has evaporated, transpired or been consumed by humans or livestock, or is polluted to the point of being unusable by other users and is therefore not released back to surface water, groundwater, seawater or a third party over the course of the reporting period. |
| Water discharge | Sum of effluents, used water and unused water released to surface water, groundwater, seawater or a third party, for which the organization has no further use, over the course of the reporting period. |
| Water withdrawal | Sum of all water drawn from surface water, groundwater, seawater or a third party for any use over the course of the reporting period. |
We unite to collectively consolidate key frameworks to accelerate cross-sectoral business alignment on how to measure and report on regenerative agriculture outcomes.
About the Initiative
The opportunity of regenerative agriculture
Regenerative agriculture has gained momentum as a holistic solution to address climate challenges, reverse biodiversity loss and enhance soil health. Forward-thinking farmers have been pioneers in adopting regenerative practices on their lands.
However, to scale up regenerative agriculture into a solution that drives a significant impact on the environment and help society live within planetary boundaries, it is urgent to agree on how to measure and reward the outcomes at both the farm and supply chain levels.
The strong momentum to transition to resilient and regenerative agricultural models
The private sector is increasingly embracing regenerative agriculture for several reasons:
1. Value chain resilience: The agricultural industry is highly dependent on nature for ecosystem services, making it particularly vulnerable to climate change, biodiversity loss and water scarcity.
2. Companies and financial institutions are shifting from voluntary to mandatory sustainability reporting and disclosure, which includes ambitious net-zero emissions and nature-positive strategies.
3. Financial investments in regenerative agriculture are on the rise, supporting and de-risking the transition of farmers to these practices.
4. Favorable policy environments in regions like North America and the European Union are creating incentives for the adoption of regenerative agriculture, encouraging businesses to champion this cause.
Why alignment on outcomes and metrics is important?
The time for pilots is over. To scale regenerative agriculture and harvest the proven benefits, the regenerative agriculture ecosystem needs to align on the outcomes regenerative agriculture should yield, and how all can measure whether the outcomes get achieved.
1. Unlocking Financial Incentives and Investment
One of the primary reasons for aligning on metrics is to unlock coordinated financial incentives and investments in agriculture. Various actors in the ecosystem, such as The Sustainable Markets Initiative (SMI), emphasize that creating market-based financial incentives for environmental outcomes, such as carbon sequestration and biodiversity enhancement, can make regenerative agriculture a more compelling economic proposition for farmers. This approach is necessary to meet the ambitious targets set by global climate commitments and to secure long-term food security.
2. Ensuring Consistency and Comparability
Standardized metrics enable the comparison of performance across different farms and regions. This comparability fosters competition and drives continuous improvements in environmental and socio-economic outcomes. Consistent metrics also build investor and stakeholder confidence, as they provide a reliable basis for assessing the impact of regenerative practices and the return on investment in sustainability initiatives.
3. Supporting Regulatory Compliance and Supply Chain Collaboration
Aligned metrics facilitate compliance with emerging regulations that mandate sustainability reporting and set ambitious targets for net-zero emissions and nature-positive strategies. By adopting a common framework for measuring outcomes, businesses can ensure that their practices meet regulatory standards and support broader policy goals. Additionally, standardized metrics enhance collaboration across supply chains, as all stakeholders can work towards shared objectives and measure progress using the same benchmarks.
4. Encouraging a Shift to Outcome-Based Rewards
The transition to regenerative agriculture represents a shift from practice-based to outcome-based rewards. Farmers are incentivized based on the regenerative impact they achieve rather than the specific practices they implement. This flexibility allows them to adopt methods best suited to their local environmental conditions and cultural preferences, fostering innovation and adaptability. Outcome-based metrics require all actors in the value chain to actively measure and report on their environmental and socio-economic impacts, driving a collective effort towards sustainability.
5. Improve Internal Decision Making
The focus on a holistic set of outcomes and affiliated metrics ensures different functions within businesses can take decisions cohesively beyond the basic financial measures. For example, the use of a holistic set of outcome-based metrics allows for broader selection criteria in investment decisions and performance evaluations.
Our collective journey so far
The World Business Council for Sustainable Development (WBCSD) has prioritized strengthening the climate-, nature- and equity-related Corporate Performance and Accountability System by launching the joint Regenerative Agriculture Initiative with the One Planet Business for Biodiversity (OP2B) coalition.
To date, we have co-developed a short list of cross-sectoral regenerative agriculture outcomes, aligned with key sustainability frameworks, planetary boundaries and UN SDGs to be considered depending on the context. We have identified indicators and metrics that are most aligned with key sustainability frameworks and reporting and disclosure standards. These findings can be referenced to help accelerate broad-scale public and private investment. Outcomes and metrics have been proposed based on analysis of existing frameworks and refined through scientific review and series of deep dives to refine toward the outcomes.
1. Global businesses
52 companies, representing the agricultural value chain for food, fiber and feed, to unite and support a core set of metrics and methods
2. Business-focused initiatives
33 partner organizations, including Textile Exchange and SAI Platform that collectively agree on the need to align, representing and impacting 1100+ businesses collectively Within individual sectors, Textile Exchange’s Regenerative Agriculture Outcome Framework (fashion/apparel/textile sector) and SAI Platform’s Regenerating Together Global Framework for Regenerative Agriculture (food & beverage sector) provide the reference point for key sector-specific regenerative agriculture outcomes and measurement of impact.
3. Multistakeholder ecosystem alignment
Fostering alignment on regenerative agriculture beyond the private sector requires a collective effort. WBCSD is a partner of Regen10, a global multi-stakeholder initiative working to support an inclusive, regenerative and equitable agri-food systems transition.
Regen10 is developing a holistic, farmer-centric outcome-based framework that considers all dimensions of the agri-food system, including social, economic, and environmental aspects. The Regen10 Framework provides farm and landscape outcomes, recognizing that regeneration must happen in both contexts. It illustrates how on-farm efforts contribute to, and are influenced by, wider changes and dynamics within landscapes where communities and ecosystems are interconnected through shared geography and ecology.
The Regen10 Framework does not aim to duplicate or displace existing measurement systems, assessments, or agricultural approaches, but instead provides an aligned language and vision for all stakeholders on what regenerative agrifood systems can and should achieve. The Regen10 Framework aims to act as a guiding star for implementing regenerative approaches at farm and landscape level, highlighting the need for a shared responsibility amongst all key actors in the agri-food systems.
The Regen10 Framework, which is still a work in progress, has been developed over the past two years by many of the organizations within the Regen10 initiative, including WBCSD, World Farmer Organization (WFO), International Union for Conservation of Nature (IUCN), Food and Land Use Coalition (FOLU) and Sustainable Food Trust. Developed, through extensive collaboration, consultations, and trials with these organizations, their members, partners and others. The Framework development was initiated by a review of over 150 frameworks, with a deeper analysis of 18 of the most relevant to Regen10’s mission. Regen10 published the Zero-Draft of the Outcomes Framework at the 28th United Nations Climate Change Conference (COP28), with the next version planned for 2025.
Through WBCSD’s Regenerative Agriculture workstream and its connection with the Regen10 Outcomes Framework, WBCSD aims to identify and align on an integrated measurement architecture, connecting global ESG-level outcomes with those at the landscape and farm levels.
Private sector alignment on outcomes to date is currently well aligned with the Regen10 Framework on environmental outcomes, with increasing private sector interest in aligning on social and economic outcomes. Next steps could include further collaboration to help foster this alignment.
It will be important to consider how metrics at farm and landscape level can translate into the corporate reporting metrics identified by WBCSD’s Regenerative Agriculture workstream. This alignment is critical for translating corporate commitments into tangible and farmer-centric measurable progress on the ground while ensuring coherence across scales. By fostering consistency and transparency, this effort supports businesses in making informed decisions and drives coordinated action toward the regenerative transition.
Key Findings
We call for a holistic approach to regenerative agriculture that encompasses three categories: environmental, social and economic outcomes at farm, landscape and corporate ESG levels.
There is alignment on core regenerative agriculture metrics for Climate, Water and Biodiversity, in line with key sustainability frameworks and reporting and disclosure standards. Organizations support and recognize them as decision-useful and key to quantify progress. There is alignment that data collection and reporting guidelines need to be shared across different stakeholder groups.
Leading agri-food companies are translating this alignment into action; publicly reporting progress against the shared outcomes, indicators and metrics they helped define.
We recognize that there are feasibility gaps that we need to address to quantify progress against the eleven outcomes and that we need to retain flexibility to allow for context-specific approaches for their quantification.
There is less consensus among stakeholders on how to measure outcomes related to soil health and farmers’ well-being due to context-specificity, feasibility of data collection and limited metrics in reporting & disclosure frameworks.
WBCSD will continue to facilitate the system-wide transition to regenerative agriculture as part of a broader drive for corporate performance and accountability on climate, nature and equity as well as action at the landscape level and an enabling environment.
Connect and join our efforts
Are you interested in joining our collective mission and rallying behind the aligned outcomes and indicators?
Companies and business-focused organizations can join this collective cross-industry initiative committed to driving a shared vision for regenerative agriculture.
We offer the opportunity to demonstrate your alignment, contact us to get involved.
Partners that have contributed include
FAQ
1. What is regenerative agriculture (RA) and how does it work?
2. What are the key principles of RA?
Regenerative agriculture principles often manifest in the adoption of context-specific agronomic practices that lead to improved outcomes (observed in the Regenerative Agriculture Outcomes section). They often encompass restoring carbon, water, and nutrient cycles in order to enhance soil health, limiting disturbance, armoring the soil, increasing biodiversity and improving farming livelihoods. This approach aims to promote sustainability, resilience, and environmental stewardship in agriculture. Additional principles may apply to specific farming systems.
For more information see:
3. How does RA differ from organic, sustainable farming, and conservation agriculture?
RA encompasses a broader and less prescriptive approach as it is focused on outcomes. While these other methods share common goals and environmentally friendly practices, RA has a holistic approach, grounded in agroecological principles, of (1) supporting farming livelihoods, (2) increasing biodiversity in and around farms, (3) restoring and maintaining soil health and water retention in soil, (4) promoting above- and below-ground carbon sequestration, (5) reduce pesticide risks and improve nutrient use efficiency.
4. What are the economic benefits of RA?
5. What are the environmental benefits of RA?
6. What kind of positive impact does RA have on communities?
7. How can crop processors and food producers benefit from RA?
By transitioning to regenerative practices, the industry can contribute to reversing its environmental footprint, addressing climate change and increasing biodiversity. This can help improve the sustainability and long-term viability of the food system.
8. How can retailers benefit from RA?
By supporting RA, retailers play a vital role in promoting stability and security in the availability of sustainable products. Through collaboration with regenerative farmers, retailers ensure a steady food supply, reducing the risk of shortages and disruptions. In this way, retailers will contribute to a more resilient and sustainable food system, meeting consumer demand for sustainable goods while ensuring long-term access to quality and safe food.
9. What is the connection between WBCSD’s private sector alignment and the Regen10 initiative?
Regen10 is developing a holistic, farmer-centric outcomes-based framework, providing an aligned language and vision on what regenerative agrifood systems can and should achieve. WBCSD leads on the private sector engagement of Regen10. WBCSD has engaged members on the Regen10 Framework, as it has developed. Providing feedback at key stages, including through feedback on the first zero draft, business consultation, and engaging Regen10 partners in the thematic sub-group sprints to align on key RAM outcomes and metrics.
10. How aligned is WBCSDs private sector alignment with sector specific frameworks, including SAI Platform and Textile Exchange?
Within individual sectors, Textile Exchange’s Regenerative Agriculture Outcome Framework Global Framework for Regenerative Agriculture (fashion/apparel/textile sector) and SAI Platform’s Regenerating Together (food & beverage sector) provide the reference point for key sector-specific regenerative agriculture outcomes and measurement of impact. These frameworks, among others have been considered in the process of WBCSDs private sector alignment and are well aligned on environmental outcomes. Gaps exist between SAI Platform and WBCSDs socio-economic outcomes identified. Textile Exchange includes animal welfare outcomes that are not included in the alignment due to sector specificity.
